
ANALYSING PRICE
2. ANALYSING PRICE
If a breakthrough was going to happen in the research, it wasn’t going to be from the fundamentals, but would have to come from analysing price itself. Price is, ultimately what matters. People may be deluded in buying a stock or a market, but if the delusion continues for years, are they the fools for buying, or are we the fools for not buying? Price is the result of the combined psychology of millions of people and the markets are an expression of their collective unconscious, as they move from cycles of fear to apathy to confidence to greed, and back again. I also knew that while analysing price over 10 or 20 years in each of these markets would be much easier, the findings would likely be meaningless. With data spanning back almost 140 years for the DOW, and for over 50 years in many of the other markets, we would encounter all types of market conditions: inflation, deflation and stagflation. Low and high unemployment and interest rates. Wars, peacetime, booms and busts. For the research to have real validity it would have to span generations and encounter all conditions.
THREE AREAS OF PRICE ANALYSIS
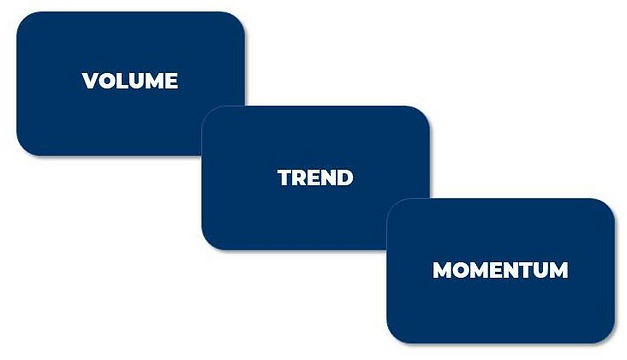
In the same way that the fundamental analysis had been subdivided into three areas, the preliminary research into price had flagged up three key approaches that justified further analysis: • Volume. How predictive is share volume towards price? Can strong volume validate or weak volume invalidate a trend? • Trend. How can we predict the general direction in which an asset is moving and is going to move? Can we determine if the general trend will be up, down or sideways? Can it give us an accurate broad view of the market? • Momentum. How can we assess the strength with which an asset is moving? Is the signal strong or weak and how does this correlate with turning points in price? Can it give us insight into the strength and sustainability of a move?

INITIAL FINDINGS
Historical analysis was performed across all markets, building thousands of different models using varying amounts of model data and testing on holdout data.
VOLUME
Volume analysis initially proved promising. Multiple approaches were designed, including calculating cumulative volume over multiple timeframes for trend confirmation, combining price with volume for timing entry-points and reversals, and designing multiple different kinds of oscillators to assess buying and selling strength.
Some of these approaches proved effective at particular times, especially after lengthy periods of market consolidation when they could help confirm a breakout. Another effective time was during a very strongly trending market (up or down) when volume was helpful in confirming the trend.
One of the difficulties with the volume analysis was that volume data is lacking in the early years of many markets. For example, the Gold and Silver markets lack reliable volume data for the first decade in the 1970s. Accurate volume data exists for the DOW since 1970, but the earlier years from 1885-1969 has no volume data.
MOMENTUM
Around 30 primary methods were designed and tested for momentum analysis. Several of these involved novel approaches to the design of oscillators which produced promising results.
Momentum analysis was quite effective in predicting and capturing movements in different types of market conditions, especially during periods of high volatility, and also proving capable of predicting short-term trends.a
COMBINING TREND AND MOMENTUM
The results of all three areas produced encouraging results, with trend being the most fruitful followed by momentum. Examining the data in more depth, it appeared that the abilities of trend and momentum methodologies across different markets might be complementary to each other, and might be superior to the sum of their separate parts.
This led to further research into many different ways of combining the separate approaches, still using multiple different algorithms to represent each approach.
A linear combination of the two approaches, or simply requiring both to confirm a trend, produced superior results across multiple markets in holdout testing than either method on its own, which was promising, and confirmed the initial speculation. However, I hoped that there might still be a superior way to combine them.
LESSONS FROM SACRED GEOMETRY AND GYM EQUIPMENT
While pondering this problem, I was reading about Fibonacci sequences (0, 1, 1, 2, 3, 5, 8, 13 etc.) where each successive number is the sum of the two previous numbers. When using these numbers to draw circular arcs which connect the opposite corners of a square, you get beautiful logarithmic spirals which closely resemble the design of nautilus shells in nature. I remembered being at a gym a number of years ago which specialised in Nautilus exercise equipment, and having a demonstration of its unique features. The machines used a unique pulley system called a Nautilus CAM, which instead of being round, is shaped like a nautilus shell.

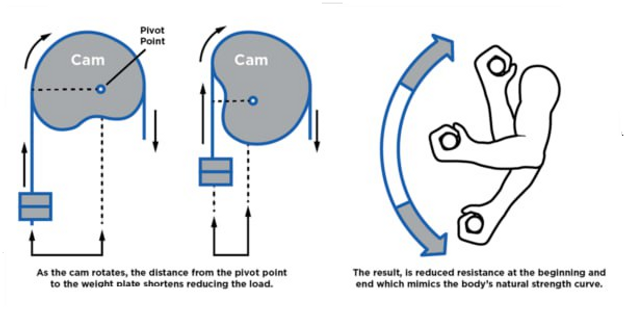
The effect of this is that resistance is not applied in a linear way throughout a range of motion, but varies according to how far you are into the movement. At the beginning, you experience reduced resistance, building to maximum resistance in the middle and then reduced resistance again at the end. This closely matches the body’s natural strength capacity which is greatest in the middle phase of an exercise. I wondered if a similar principle could be applied to the challenge of combining the two primary methodologies: trend and momentum, to predict price. Instead of using a linear relationship between the two, we created a custom algorithm which measures where you are in a cycle, and applies less or more of each methodology accordingly.

The results were striking. They surpassed anything that had been achieved by the other techniques we had tried previously, but more importantly, the results exhibited more consistency across a range of market conditions, including the most difficult - sideways periods. This was the breakthrough we had been seeking and provided the impetus to proceed with the next phase of the project, beginning with establishing a benchmark.